We’re logging the usage statistics to InfluxDB (start events + stop events), however we’re not finding that a particularly easy format to work with to produce a dashboard of running jobs (past & present). Does someone have a working example of a monitoring dashboard, preferably using Grafana?
I didn’t really understand how to use Influx, and ended up installing a bunch of other things (Chronograf, Telegraf, etc.) and it ended up turning out really well.
I followed this this readme (github) from influxdata and it gave me a dashboard, influx queries and data, and all sorts of other server information.
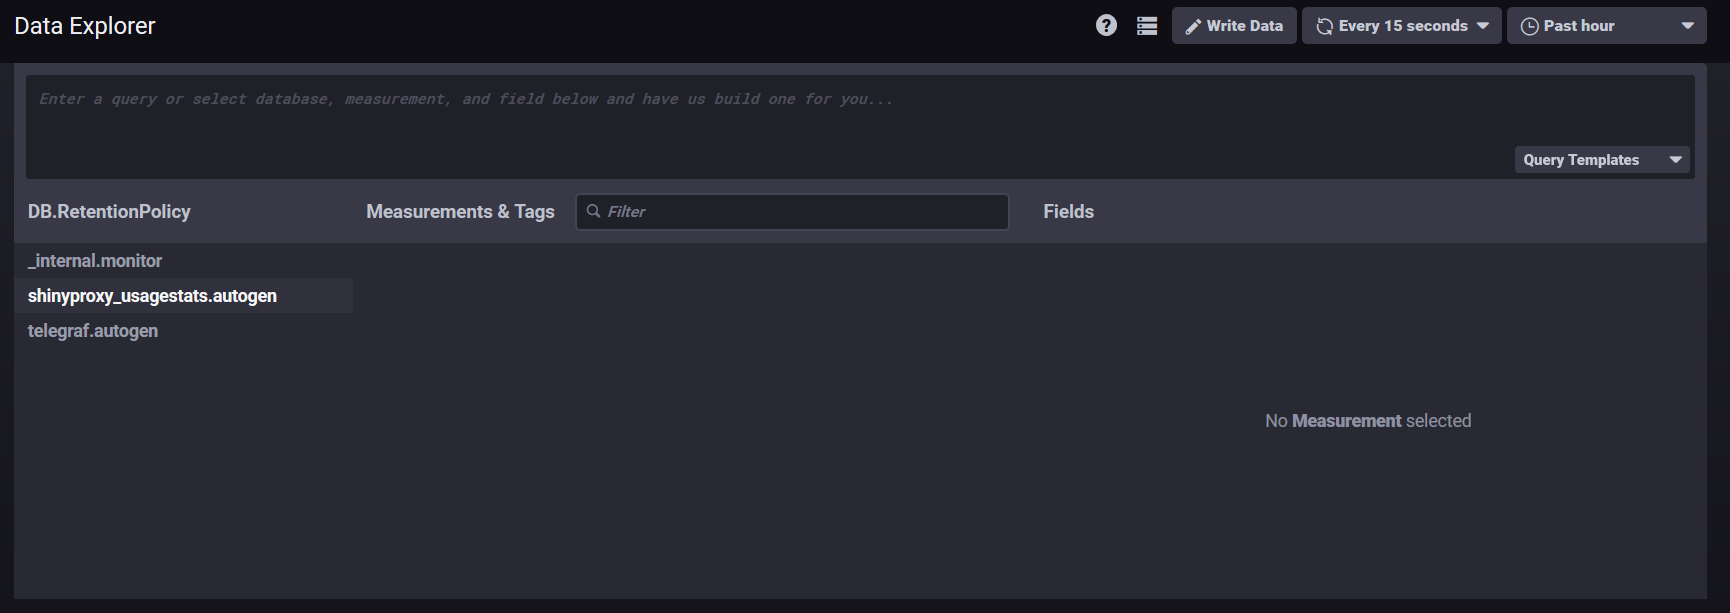
@Kalob I also followed this guide and got it working. On the Data Explorer page, I can see the shinyproxy useage stats, but there are no variables to select. How did you get when (and which) users are logging in?